
We gathered over a million observations for New York City, presenting us with the challenge of thoroughly cleaning the data. This process involved eliminating redundant listings (such as those where one user has multiple listings or where one record includes two or more rooms as separate listings), null listings (accounts that were not properly set up or not available for booking), active but never booked listings, and ghost listings (those that were booked in the past but can no longer be booked due to blocked availability, either by the host or Airbnb).
To further narrow the scope of the project and meet the three-month timeline, we focused on Manhattan, New York. The data was trimmed to fit the borough boundaries, and Manhattan was chosen due to its highest concentration of points of interest and the top ten subway stations with the highest ridership in the city. This resulted in 47,542 listings across Manhattan.
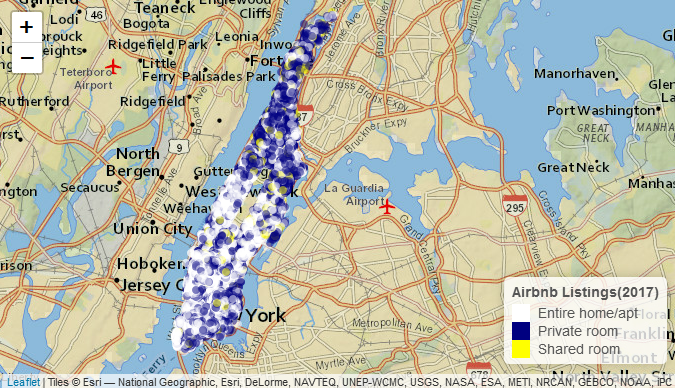
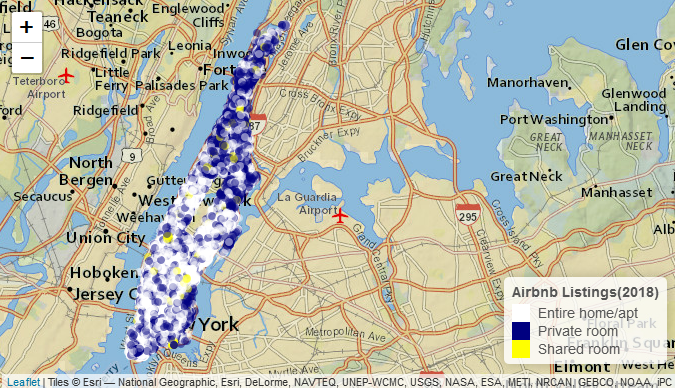
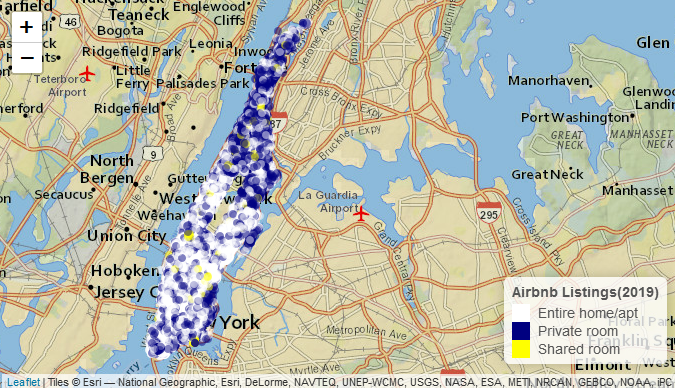
As shown in the map in the top left corner, the majority of private rooms are located in Upper Manhattan and Harlem. Over time, the highest concentration of listings has consistently been around Central Park, particularly in Upper West Side, Upper East Side, Hell’s Kitchen, and Midtown Manhattan. Hell’s Kitchen, in particular, has the highest density, with 1,800 listings in a single neighborhood. Listing prices in Hell’s Kitchen and Midtown Manhattan are among the highest due to the presence of major stations like Times Square and Union Square.
A notable trend observed is the decline in ‘Entire home/apt’ listings over time, though it remains the dominant room type. This shift, particularly in the southern areas like Lower Manhattan and East Village, can be attributed to the new Airbnb regulations imposed by the city, which are significantly impacting the housing market. More units are becoming private rooms rather than entire apartments.
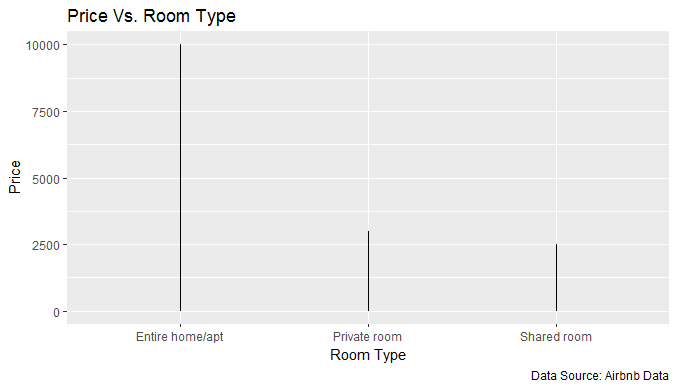
Our OLS regression analysis clearly showed that price is significantly influenced by the number of reviews, room type, and the number of bookings.
It is notable that the prices of private and shared rooms are nearly identical, which likely contributed to the lower accuracy of our regression model. This is because the model lacks the primary factor of dependence—”location.” While Geographically Weighted Regression (GWR) could have demonstrated this, it was not explored due to time constraints. We assumed that location normalizes the price, leading to the conclusion that prices are more dependent on location than on room type. Additionally, the highest prices were observed within a quarter-mile buffer around Times Square Station and Union Square & 14th Street Station, indicating a strong correlation between price and location.

This suggests that points of interest and proximity to public transit play a more significant role in guests’ decision-making when booking a listing than room type. Another key observation is that prices in Manhattan have remained relatively stable over the five-year period, as evident from the raster DEM layers shown below.

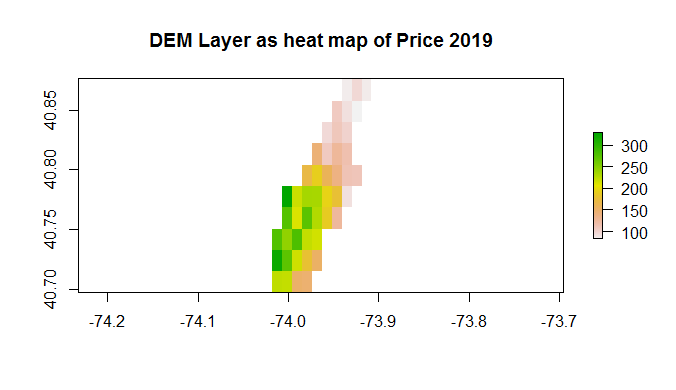
These were some of the key observations. The project will continue to explore GWR results to gain a deeper understanding of the relationship between price and location.

Leave a comment